
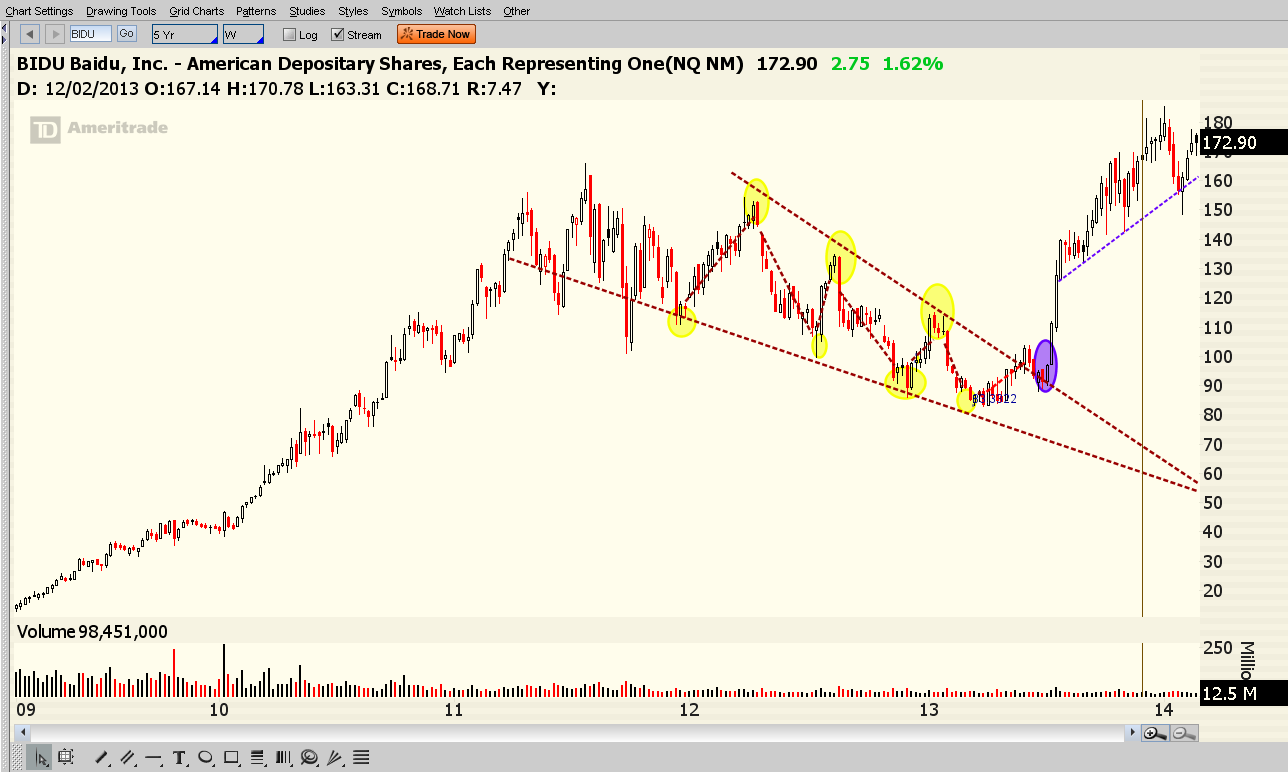
Early last year, with Citigroup reiterating their sell on BIDU at $83, I was busy pointing out the beautiful falling wedge on the stock. This bullish reversal pattern has a habit of resolving sharper to the upside.
$BIDU reported earnings last night and is now up over 100% since I highlighted this chart formation, and the stock looks poised to take out the $200 barrier.
Charts do matter, and while the stock sometimes does not go the way the chart says it will, more often than not it will.
Here are a few of my charts and videos from stocktwits last year before $BIDU mounted this massive rally:
http://stocktwits.com/message/12602555