 A pile of leaves, in the form of a massive two week stock market rally, has concealed a road with many cracks. Cracks that may continue to widen. Are we out of the woods yet? Or is this market setting up for a nasty fall?
Yesterday the stock market continued its strong showing, posting a modest gain at the closing bell. The overnight session, however, has seen those gains evaporate and turn into losses.
We are nearing key support levels, the first being the 2,000 S&P500 futures figure that held on Friday. Next up is the resistance that was capping the recovery from the August crash.
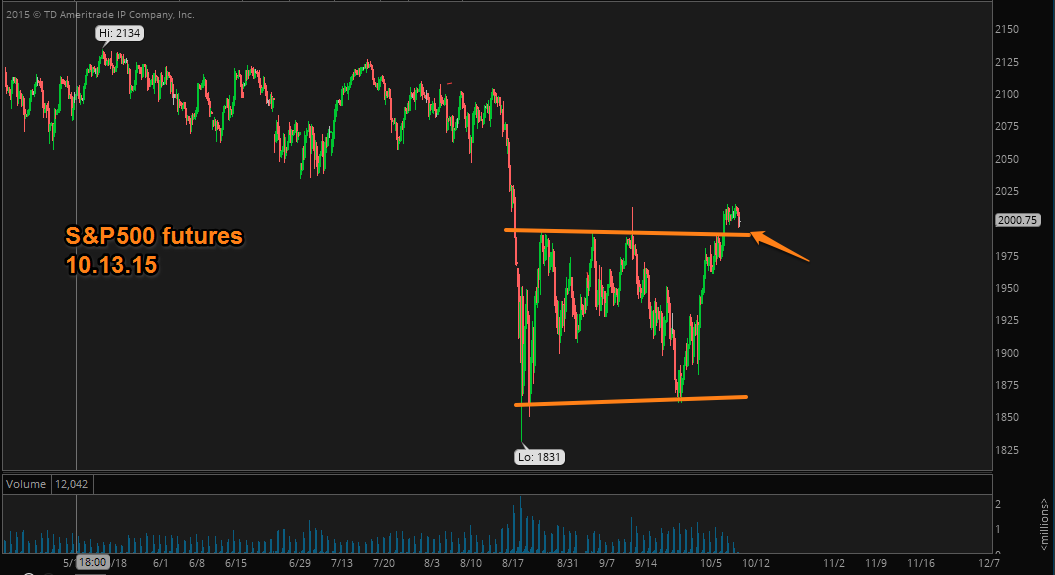
Where are we now?
A case could be made that the market has topped. There were so many calling for the market top over the years amid an uptrending market. That trend has come to an end.
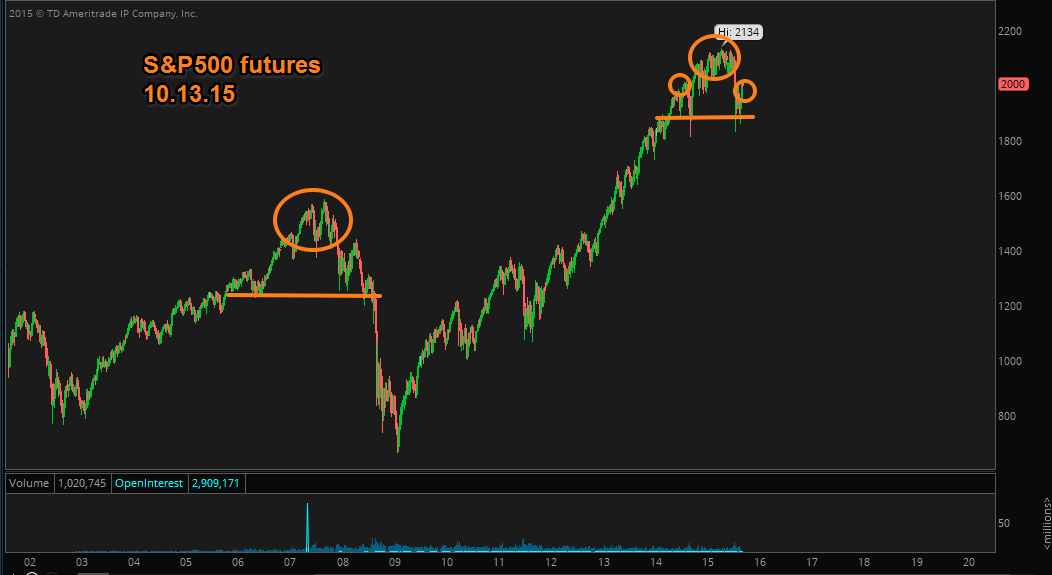
We've also seen some of the leaders turn over and turn into laggards. Amid a global asset price manipulation scheme led by every Central Bank in the world, trading for downside is not easy or popular. But we know how quickly the downside action can appear, and it makes sense to at least consider what the longer term price action is telling us.
The Dollar?
The US Dollar index is key in the months ahead. It's setting up for another move and I think this one will send it to fresh 6+ year highs. The implications of this move will be felt around the globe. With emerging markets catching the brunt of it. The stronger US Dollar will coincide with continued commodity weakness and be a headwind for corporate earnings.

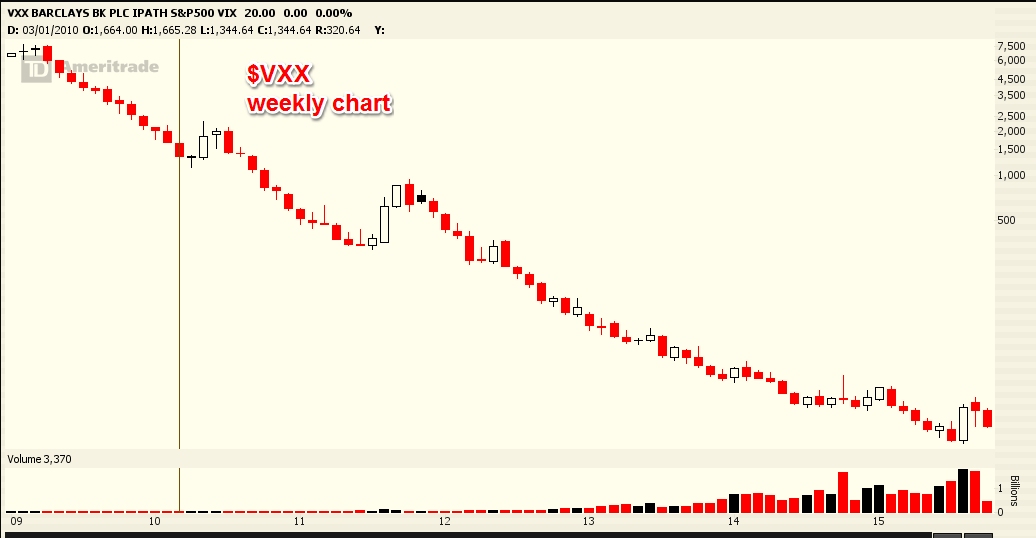
How bout that VIX?
And the VIX continues to tip it's hand. Throughout the move the last few weeks, the VIX has been a great leading indicator. Despite some intra-day swings and pull backs, the VIX has continues to drip lower... like an ice cube left out in the sun.

$VXX as the victim of another beat down yesterday.

$VXX from over $7,500 to $20 in 5 years. Over that time every bounce has been short lived. Is this recent bounce different?
How about that Crude?
Crude oil rallied in a big way last week. Yesterday crude gave up some of those gains, and as I noted yesterday and in previous market videos/chart, the rally in crude oil remains of the relief variety. The 20 year chart remains bearish.
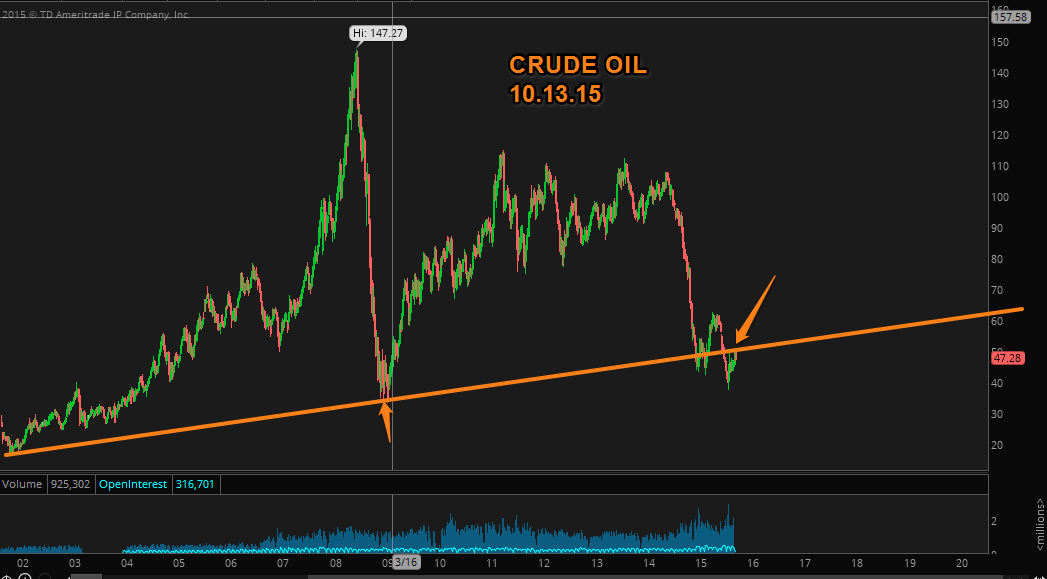
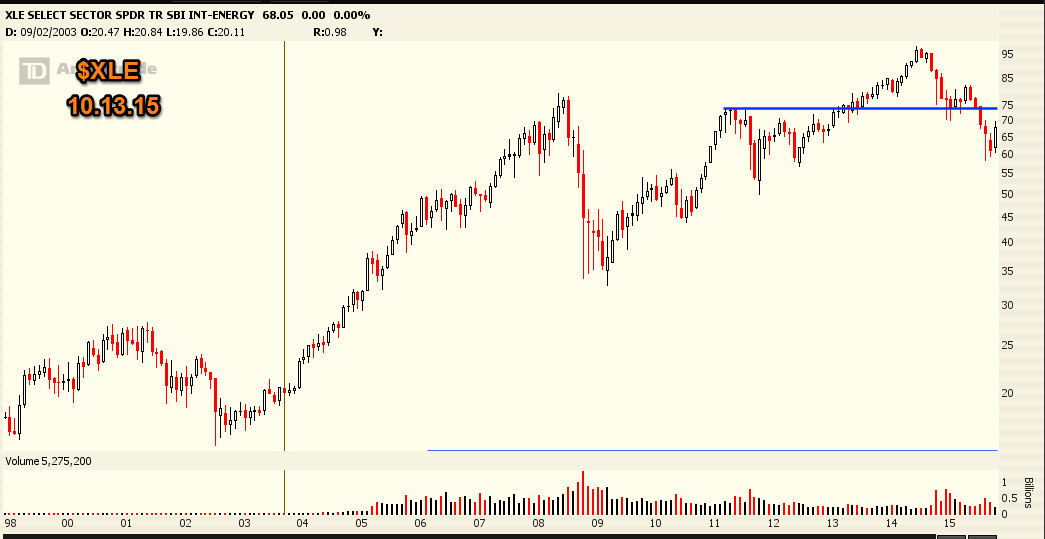
The same could be said for energy. Although not on the same 20 year time frame, I think the energy bounce was just letting off steam from a dramatic pull back.
Earnings?
Earnings continue this week with $JPM tonight after the bell. On a monthly time frame the stock is running along long term support. A breakdown under would imply the run to record highs has marked a long term top for the stock.

With 30 minutes until the opening bell stock futures are lower. If the action repeats that of the last two weeks, the losses will be mitigated as the trading session moves on throughout the day.
The short term price action remains strong. But longer term there is a reasonable chance the market, the raging, historic bull market, FED with unconventional and unprecedented Central Bank action, could be coming to an end.
See you in the chat room.