 If you are tired of relying on demon possessed, exploding dirigibles to tell you where the market is headed, you might want to take a look at an obscenely obscure indicator that has endured some remarkable success. The Heisenberg Indicator (HI), the brain child of a former Crystal Meth Chemist, has been able to sniff out tremendous moves in the market since the financial crisis in 2008.
Unlike the Hindenburg Omen, which starts to rear its head when an assortment of variables are met and usually confirms the market will move in one direction or another with varying degrees of decline, incline, and/or stabilization and implies a market that has some stocks hitting highs, and some stocks hitting lows while providing media outlets with just the right Goldilocks type fodder to feed the sheep when the genetically modified feed is running low, the Heisenberg Indicator has been triggered just one time and has a perfect track record.
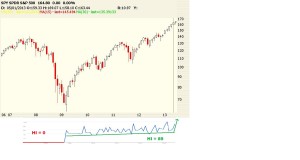
The Heisenberg Indicator (HI) reading before October 2008 and the financial crisis was zero. This was telling traders to lay low. Those who ignored the indicator simply got smoked. Once the reading crept over 30, it was telling its followers to light up their terminals and get cooking. Any sustainable rally starts with a solid cook.
This chart tells it all.
Even more mind numbing is what the HI is showing now. The most recent reading of 89 is indicating a possible new leg higher in stocks. The last time we had a reading this high was in February which ignited the markets and lifted them more than 10% higher. Now that's something to shake an Erlenmeyer Flask at. The needle for the February rally was pointing at strong buy, the highest level ever recorded for the HI. The needle is getting hot again meaning we could witness a move to fresh all time highs as we head into the summer heat.
As reliable as this indicator has been, it is no crystal ball. Just like an overused and overheated Bunsen burner, most indicators simply work until they don't any more. You can put that in your pipe and smoke it.
Can you guess what the HI consists of? If you can guess the HI you get a free month at optionmillionaires.com. Good luck.
Read more about Heisenberg:
http://breakingbad.wikia.com/wiki/Walter_White


HI = QE
good idea but not the answer we were looking for
Based on the Heisenberg uncertainty principle, measures human action in the markets or sentiment.
The triggering of the H.I. consists of: The daily number of NYSE new 52 week highs and lows are both greater or equal to 2.8% of NYSE stocks that advanced or declined in a day, The NYSE is above where it traded 50 trading days ago, the McClellan Oscillator is negative and new 52 week highs cannot be more than twice the 52 week lows.
The signal is valid for 30 days, deactivated if the McClellanOscillator turns positive.
Hydrogen Iodine