
When buying a stock, an option, or any asset for that matter, price is most important. The price you pay, and the price you expect to sell it at. For those going long the stock today, they are banking on the price of the market to be higher down the road.
I've highlighted this countless times, but it bears repeating. Over the course of history the stock market has gone up in value. Prices are higher than they were 10 years ago, 20 years ago, and so on. We've has numerous shocks along the way, but stock prices have always moved higher over the long term. Factor in dividends... and it has been even more rewarding.
And yet the obsession remains for that long awaited market crash. With many of those market crash enthusiasts seeing the same market crash today that they saw a decade or more ago with prices much lower back then compared to today.
Many of those bear market enthusiasts would need the market to drop 50% Monday, and then another 50% Tuesday just to get back to even on their initial market collapse call.
Of course we the market has been subject to numerous price collapses. Some rapid, like the Pandemic fueled collapsed that occurred in just a few short months, or the more recent reset that began in January 2022 for the S&P500 and November 2021 for the NASDAQ. In the most recent asset price correction, the downside has been methodical, slow, deliberate.. and dare I say orderly.
The downtrend intact. Prices respected that downtrend, and after proper rejection of said trendline, the downside resumed.

The respect lasted until just a few weeks ago, when the trendline was broken.

Even with the pull back this week, the S&P500 is sporting a nice bull flag into next weeks CPI report.
A nasty CPI number and the market will crumble. Which makes an interesting point heading into next week. What matters more. A long term trendline break? Or economic data?
Is the trendline break, the market, who is all knowing and smarter than all over us combined, already knowing the price action that lies ahead. Already factoring in whatever data that is coming this week with CPI on Tuesday and PPI on Thursday?
Now, couple that trendline break with a golden cross.

From our favorite AI bot -
"A golden cross is a bullish technical indicator that is used in the stock market. It occurs when a short-term moving average (such as the 50-day moving average) crosses above a long-term moving average (such as the 200-day moving average). This pattern is considered a bullish signal as it suggests that the short-term trend of the stock is becoming stronger and may continue to move upward in the long term.
The golden cross is often used by traders and investors to make buy and sell decisions. It is generally believed that a golden cross signals the start of a new bullish trend, and traders will often enter long positions in anticipation of price increases."
So...
We have a terribly bullish technical indicator, coupled with the break of a long term downtrend. From price action along, this suggests higher prices lie ahead. And as I said.. price is really all that matters. What is the recent price action telling us?
Irony I see some calling this golden cross... not so golden. Others saying the trendline break is nothing more than a fakeout before a breakdown.
We can offer all our opinions and thoughts. We can look at all the economic data, sentiment, soaring interest rates, that ungodly jobs report last Friday, and all those that remain bearish on asset prices offering up every reason under the sun why prices are poised to not just fall, but COLLAPSE. And yet... what is price telling us? What is the most important thing telling us? Right now... it's 2 for 2. A bullish break of a long term downtrend in convincing fashion. And a triggering of one of the most bullish technical indicators out there.
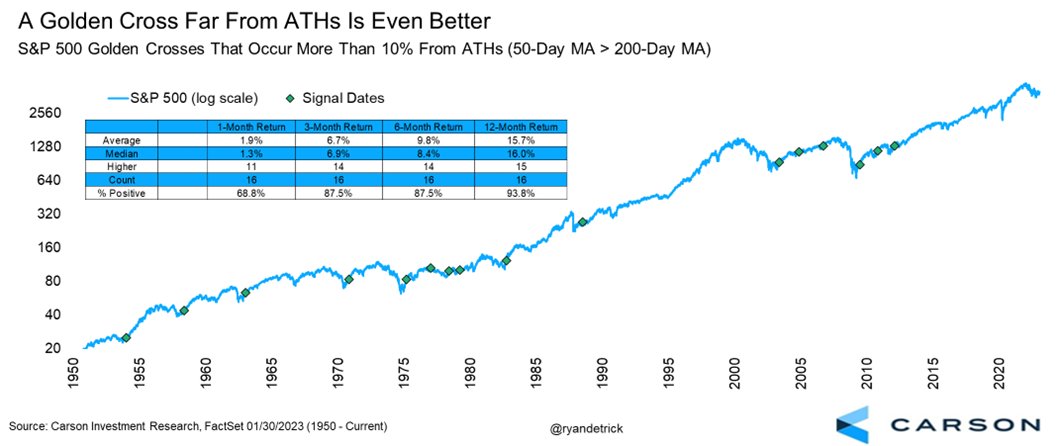
A golden cross with the market down 10% or more from highs is even more bullish historically... hat tip Ryan Detrik twitter: @ryandetrik
Will this weeks CPI and PPI numbers outweigh the recent bullish price action (Golden cross/Downtrend break). It will be a good test of what we've seen so far in 2023. Will be a test of bullish price action vs. economic data.