For Gold Members and Above

To view these post you must be a Gold or Diamond Member.

Market At A Tipping Point? Another Point Of View On The Market’s Euphoria

UPB wrote an excellent piece entitled, "Are Markets Reaching A Tipping Point?" this last Friday, expressing concern about the extremely bullish sentiment going into year end.  This mass "near-euphoria" of investors comes as little surprise, as gains such as those recorded in 2013 compare only to market gains immediately following major bear market bottoms. 

Am I concerned as yet? Simply as a matter of my own opinion, I'm not. Here's why: while bullish sentiment is reaching nosebleed territory,the bullishness is not being accompanied by a lack of buying. If buying enthusiasm suddenly began to fade, we'd start to see negative reversals in both the NYSE Advance-Decline Line and in my proprietary Supply/Demand Thrust Line (see the link below). Neither of these indicators have turned lower so far. For more on the longer term perspective of the market, check out this video.

http://s22.postimg.org/awo71du7l/SD_Thrust_Line_12_7.png

Even over the short term, the 3-DMA of % Declining NYSE Issues reached 65% last Thursday, a threshold which was only reached approximately 200 times over the past 13 years. During bull markets, this threshold typically coincides with short term bottoms.

To conclude: is it time to be concerned about a possible significant decline looming just around the corner? I don't believe so but, again, it's my own opinion. A variety of viewpoints, after all, is what makes Option Millionaires such an excellent community for those looking to learn about the markets. 

Also, will 2014 be a better year than 2013? History says that the probability is low, but anything's possible.

What are your thoughts?  Will I be proven correct or will UPB, just like so many times in the past, win the day?  Post your comments below.

~D

Private Twitter Access

Last week was $TSLA calls: the $120 strike at $1.20 hit $10.40. That's $120 into $1,040 or $1,200 into $10,400.

This week was $YHOO and $GS options.

The $GS $170 puts at $1.48 went to $5.40. That's $1,480 into $5,400.

doodaaaa

The $YHOO $38.50 puts initially yielded a 50% gain but ended up not doing so well by the end of the week if you held for that long.

One of our services is that we offer a private twitter feed as a means to see in a simple and concise manner just what we trade.

Where Is The Market Headed Over The Next 5 Weeks?

Stocks hit new all-time highs yet again, but suffered a pullback into the close. Are stocks set for a big pullback as we approach the end of the year, or will today's dip be just another fabulous buying opportunity? One chart that will help show where the market is headed is posted below. When trying to look at where the market is headed, I think understanding where it's traded previously is important. Looking where stocks have traded at specific times in the past can lend a hand in determining where stocks are going in the future.

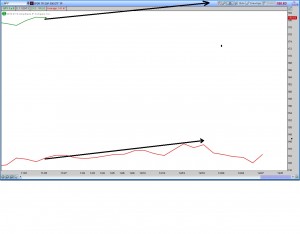
Below is a chart showing the current price of the $SPY (the green line) and the 5-year average of the $SPY (the red line).

Using price history as guide we should see a 3 percent rise from current levels heading into the Christmas holiday before a small sell-off as we get closer to the end of the year. A 3 percent rise would bring the S&P 500 to the 1,850 level and the DJIA to 16,500 before year's end.

spy12345

Short Term Market Update – Buy Or Wait?

This video is a quick overview of what would have been covered on Monday night's webinar for Diamond Members.  Many of the major market indices made new all time highs today, but the recent advances have been less than impressive.  For example, we typically like to see the % of advancing stocks match with the % of total up volume for the day.  If those numbers do not closely resemble each other, it indicates that a market segment was left behind and did not rally.  For instance, see today's rally:

http://s16.postimg.org/6u0nwvzud/Adv_and_Dec.png

This has been typical in recent weeks, as small and mid cap stocks have been left behind.  This says to me that it is a good time to be focusing mostly on buying large companies' stocks and avoiding the stocks of small companies.  If the condition persists, it would most likely end in a larger short term correction.  See this video for the details and the overview using my proprietary indicators.

~D

$HPQ Stock Looks Ready For A Big Move

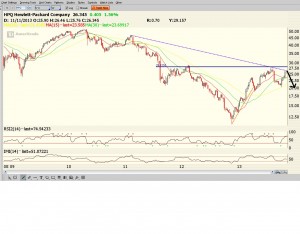
$HPQ was priced for bankruptcy at this time last year. The stock was down and out, and seemingly no one wanted to buy it. One year later the stock is flying high. I said the stock would recover, and it has: https://www.optionmillionaires.com/hpq-stock-will-reverse-course/. In fact, $HPQ is up almost 100% over the last 52 weeks. Where does it head from here? I think the stock is on the verge of a big move.

That move will be 5 to 10 percent to the downside. I'm looking for $HPQ to trade back to the $25 level over the short term and below that as you go farther out.

hpqannot111113

I am in the $26 weekly puts and alerted them on private twitter this morning at $.18 x $.20

hpq3