Tag Archives: Trends

Why $AAPL Could Be Making New All Time Highs in 2013

I wanted to follow up on a video I recorded about $AAPL this weekend with the stock at $440. $AAPL is one of the most beloved and hated stocks right now. The stock had a ferocious rally from late 2011 until it topped out in September of 2012 at just over $700 a share. It then suffered a rather precipitous fall to under $380 a share in May. That low has held so far, but have we seen the lows for $AAPL or are more declines on the way. Can $AAPL recover the glitz and glitter it had in 2012 when it rose almost 100% or is the stock the next $MSFT or $CSCO, set to suffer years of anemic growth and meager gains?


Here is my video from this weekend, just in case you haven't seen it. http://stks.co/rM6v I quickly highlighted why I think $AAPL could be back at new all time highs before the year is through. I know its a very bold prediction but I think it is very possible.


I think $AAPL is just breaking out of an almost 10 month consolidation phase. The stock had a similar phase in 2007/2008 when the stock fell to the $70's and then rallied to over $700 a share. This phase brought $AAPL to $380 and I think the next rally, which could last several years, will bring the stock to new all time highs this year and over $1,000 a year or two from now. That's assuming the financial world doesn't collapse again before then.


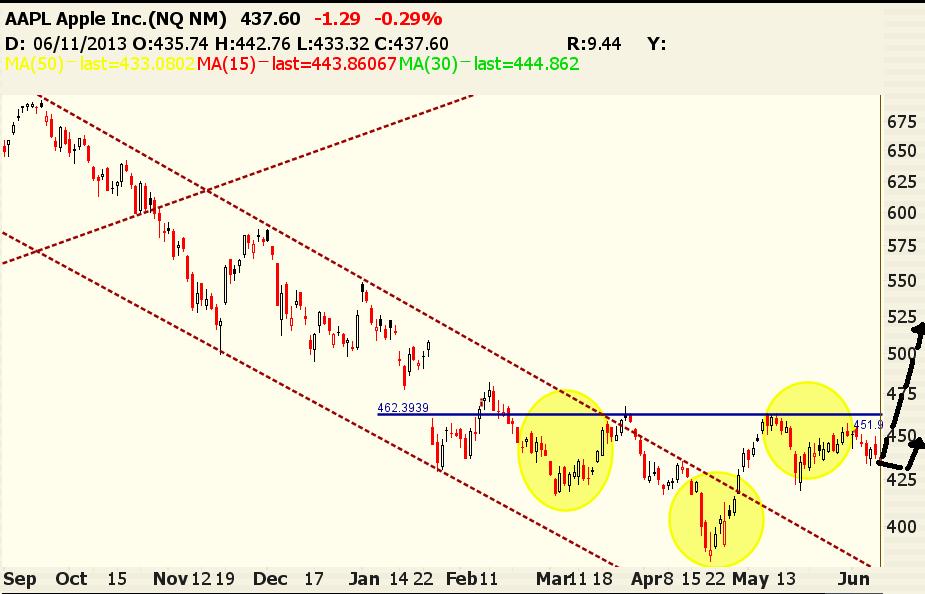
The chart below shows the consolidation phase ending in 2008 (the blue circle) and the similar consolidation phase $AAPL is just about broken out of (blue circle). The green circle represents the type of short term rally that I think awaits $AAPL, its shareholders, and its CALL buyers.


aapl730-1


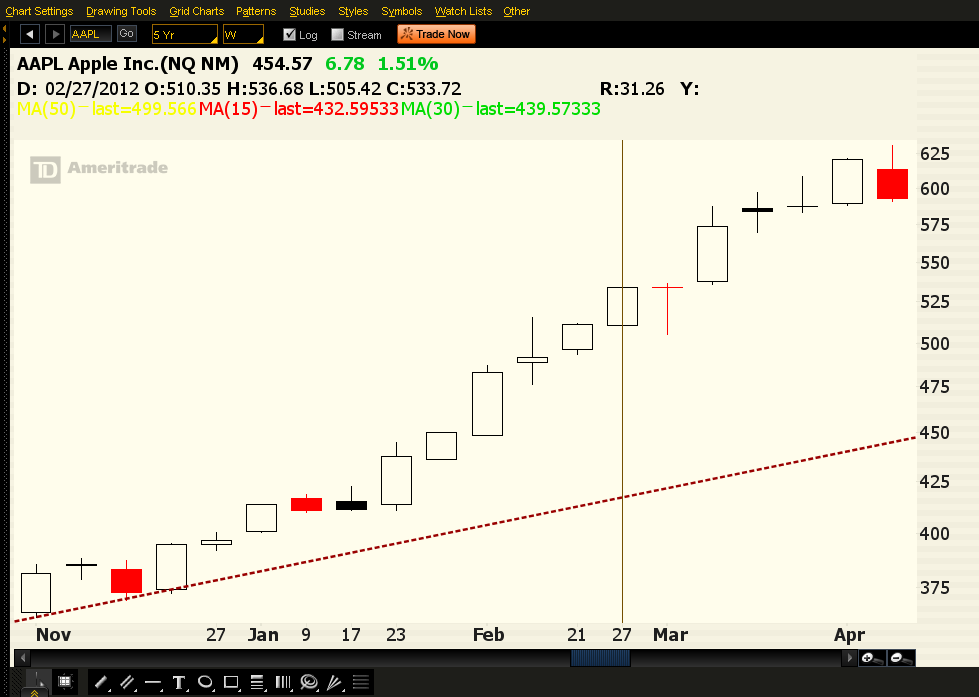
For the next few months I am looking for a move like the one we saw in the winter and early spring of 2012 (the chart below covers that move). During that time $AAPL rallied some $200. That would put $AAPL back near its all time highs, a target that I think could get broken before years end.


aapl730-9

Where are We Headed? – Chart Updates – $GOOG $AAPL $SPY

Equity markets around the globe sold off today after the Yen strengthened sending the Nikkei down dramatically after comments from Japanese officials scared investors.  We witnessed the same thing last week only to endure a remarkable recovery into the end of the week.  Was the recovery nothing but a sell-able bounce?  Are stocks poised for a big decline heading into the summer?

Two Fridays ago a late day swoon brought the bears out of hibernation.  The Hindenburg Omen!  Dirigible debris filled the sky.  The end was near, sell everything and head for the hills!  The bull market is over..... yet stocks closed the week higher.  Go figure.

We find ourselves this week in a similar position.  The bears are out of their caves, the fear is palpable, stocks are vulnerable, yet I think we have a good chance to close the week higher than we started.  I'm not sure there are many people saying the same thing.

Below are a few charts for $AAPL, $GOOG, and $SPY.  These chart are my opinion only as are where I think the market and these stocks are headed.

goog611


Based upon the last 9 months of trade for $GOOG I think 3 scenarios are possible but feel the most likely scenario is a move over $900.  Late last week I told the chat room that I thought $GOOG was starting to curl after a long consolidation.  That curl upward should lead to new all time highs.  I don't think it happens this week but it will happen within the next few.

aapl611


$AAPL remains well positioned for a move to $500, its just a matter of when.  A few months ago I said the same thing about $BIDU with the stock at $84 a share, saying $100+ was coming.  It took a little longer than I thought it would, but it came just the same.  $AAPL the only question, in my mind, is when this move will occur.  The bottom for the year was hit in April.  I think this will hold.  Right now we are looking at a very nice inverted head and shoulders and this will resolve 20% to the upside.

spy6111spy611


$SPY in my view has also bottomed for the time being.  We are looking at a possible inverted head and shoulders.  This should resolve with higher prices.  I think $166+ on the $SPY could be hit this week going exactly against what everyone else thinks will happen and putting the few remaining bears out  to bed again.  Good night.

Finally, if someone put a gun to my head and asked where these stocks will close the week, I would calmly answer:   $SPY $165.20, $GOOG 905, and $AAPL $450.

Guessed It Right

$GES had a strong move higher today, and was up over 10% in the middle of the session.  Why am I telling you this?  Earlier this week I penned a blog post entitled " Buying Calls Ahead of This Earnings Report".  https://www.optionmillionaires.com/2013/buying-calls-ahead-of-this-earnings-report/

The earnings report in question was GES.  I purchased the GES calls at $.80 the next day as I said I would in the blog post.  Today those options topped out at $2.05 and closed 109% above yesterday and Wednesdays close.  Barring a complete collapse of the equity market I think $GES is headed higher into the summer.    I will turn to September calls, but will wait until we get a pull back to around $30.  I like the chart, the inverted head and shoulders, as well as the strong break above the long term resistance trend line.

If I do enter the SEP calls I will post my trade in the chat room and/or forum.

ges2


Here is the chart I posted at the start of the week.


ges2