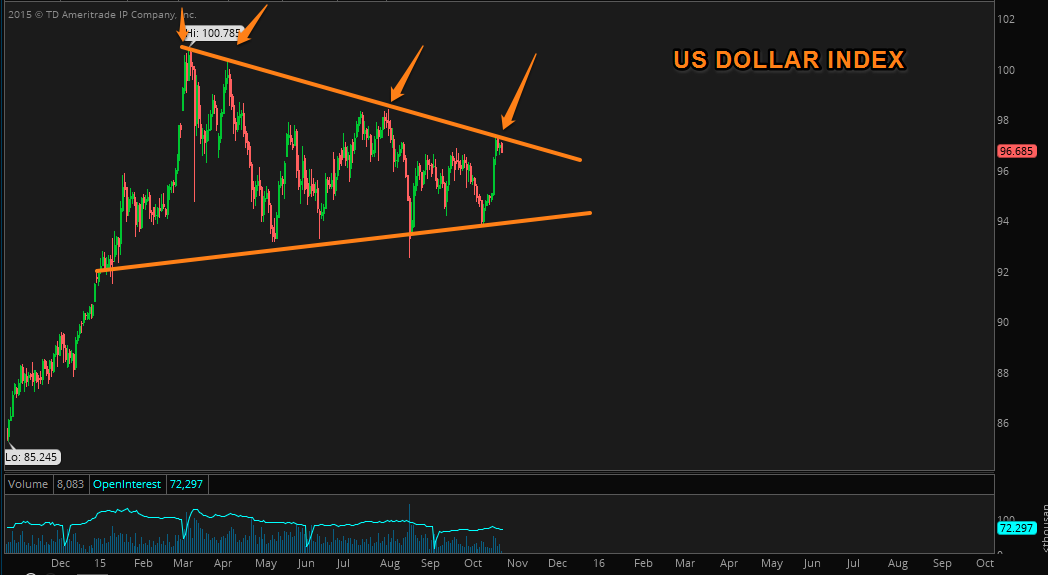
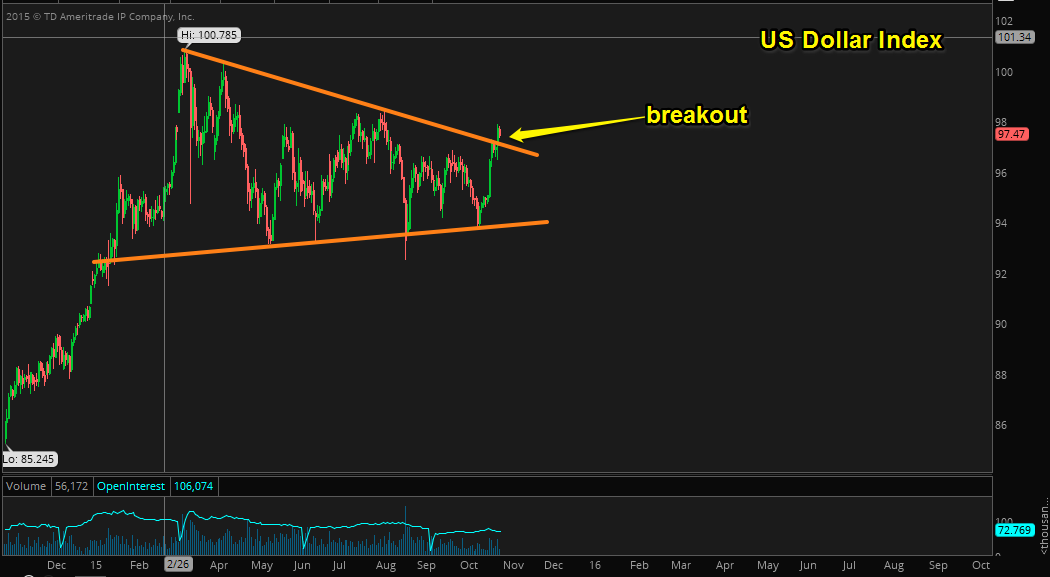
The US Dollar continues on the path to new 7+ year highs. As I have stated previously, longer term this will not be bullish for the stock market.
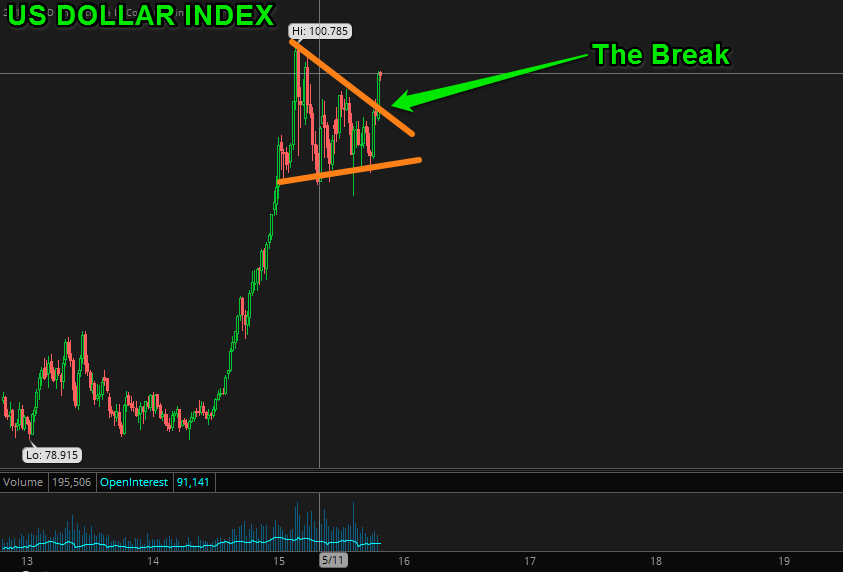
and what will this mean for crude oil? ..... exactly what it has meant historically - Lower prices.
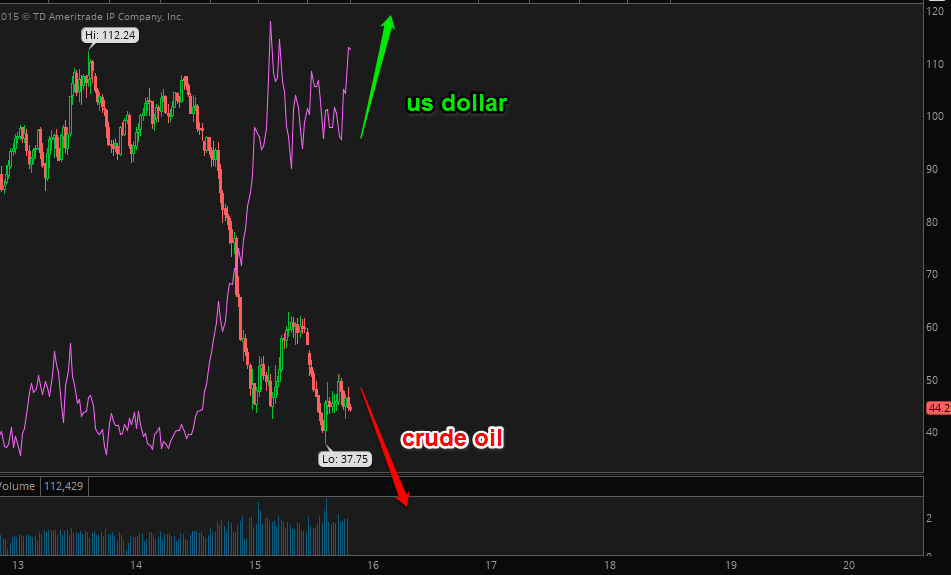
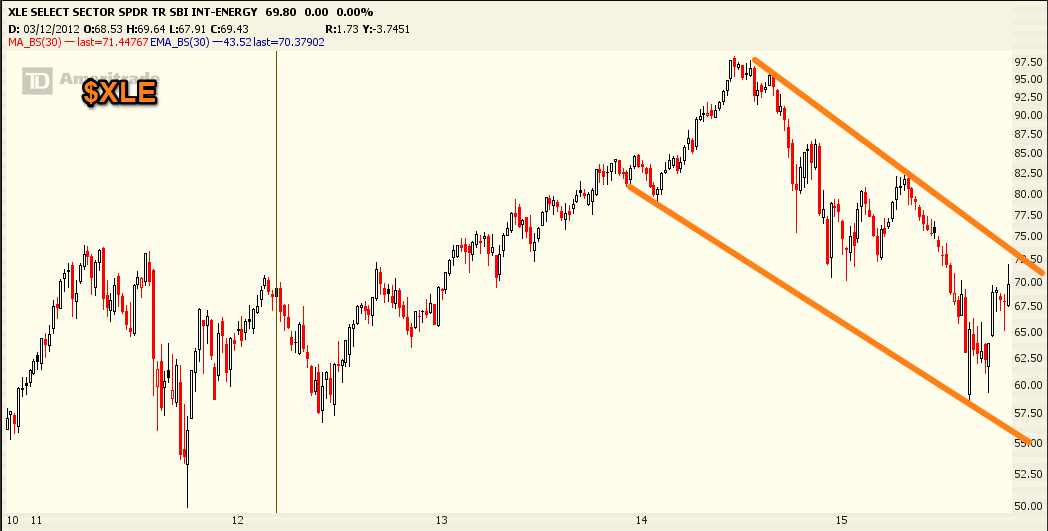
which does not bode well for the energy sector. It has been quite a bounce, but one that will prove to be short lived:
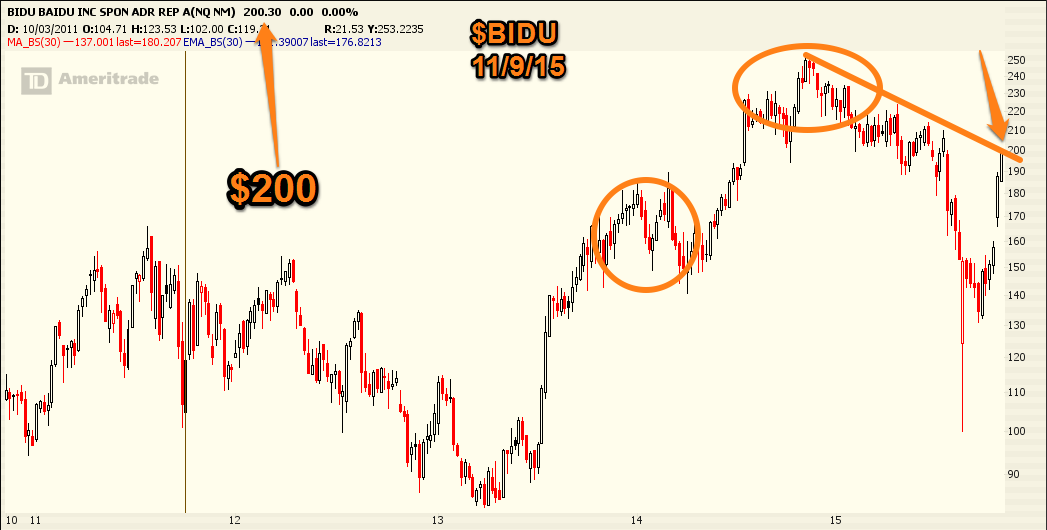
$BIDU came up to meet $200, which also coincided with trend line resistance. A pull back to $180 is the likely scenario.
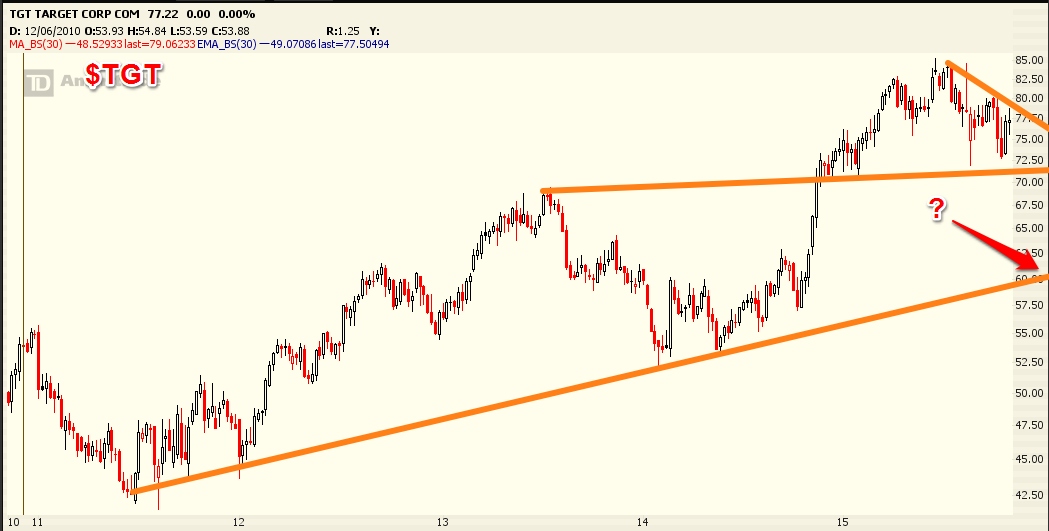
$TGT looks weak, and a break of trendline support could set up a move to $60.
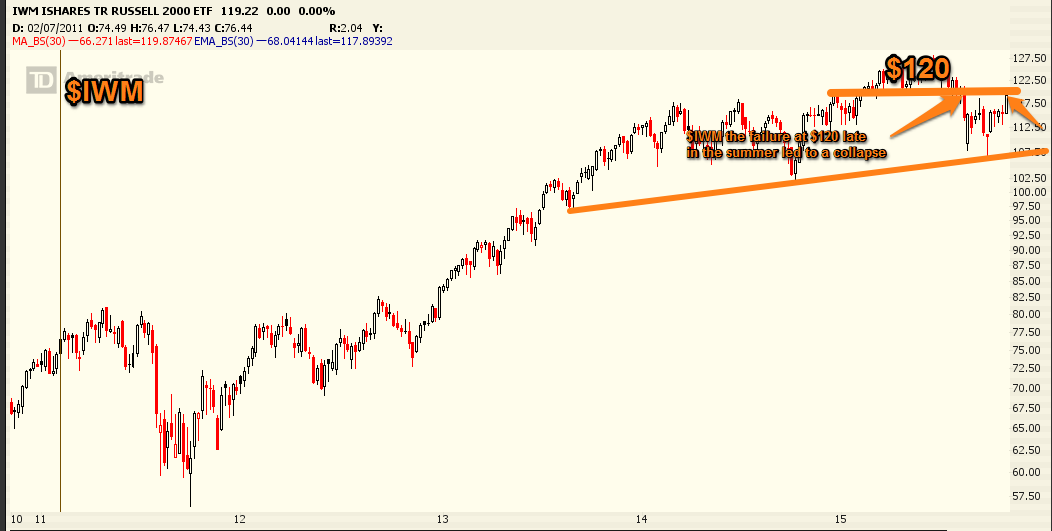
$IWM needs to break that $120 level. IWM back to that $120 figure that has been key throughout 2015 - with the lack of support late this summer the tell