Friday Morning Reads, Charts, and More
News and Reads
Charts
Premium
More Charts
YESTERDAYS RECAP
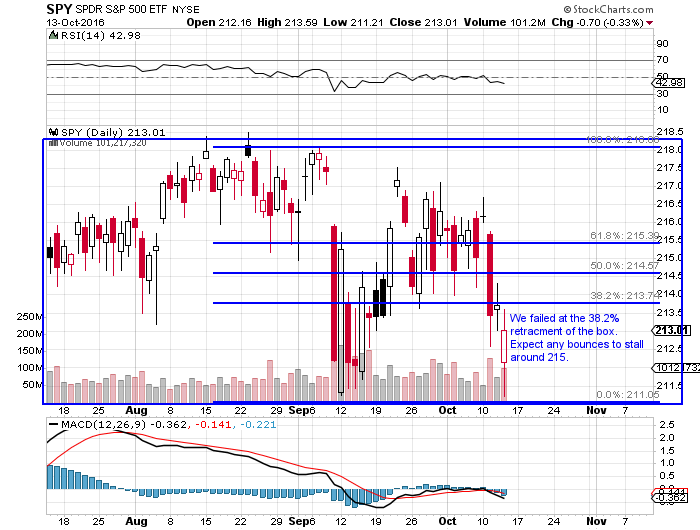
Today was quite the reversal for the market. In the morning the market plunged down to fresh lows in the 211 range. Soon after it started to make its way back up to close only slightly down.
In the article I will post a few levels to watch and different trades in a few stocks. First, a note on intra-day trading and trends. There are a few times throughout the day when I look for trend reversals. First, its at the open. If you see a huge thrust one way or the other at the open it is usually a sign that the bias will hold for the whole day. The next is 10:30. Sometimes there is a ‘shake-n-bake’ to get people out of positions and then an immediate reversal. This is a good time to trade off of support/resistance. Lastly, its 3:30. A day like today, I after 1-2pm we got the idea that the market was going to bounce into the close, the trend was higher for hours and we saw a lot of hammer candles forming. However, premiums were starting to increase with this reversal. Many times the trend will form and then reverse near the close like it did today. This is why when the market reverses one way or the other I like the wait until near the close and see if the candle ends up being bullish/bearish and whether it lines up with momentum.
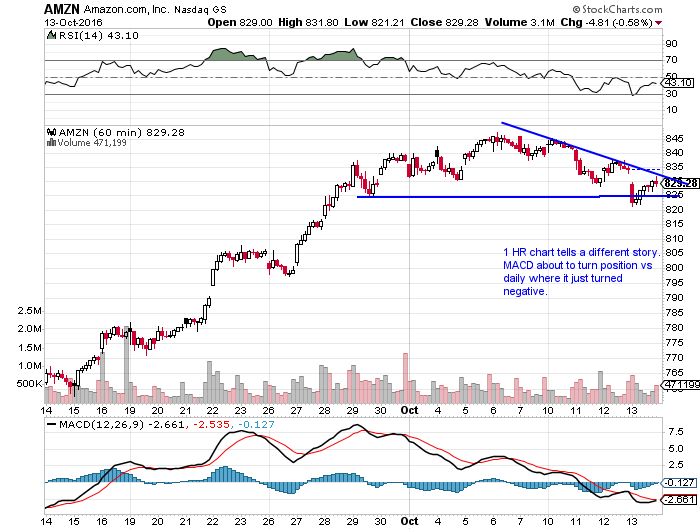
For example, today the market sold off into the close but the candle was still relatively bullish in many names, like SPY and AMZN. However the MACD in both is negative. To me, this means there is an unnecessary risk in going long overnight, rather the r/r is better to see if there will be a trend reversal tomorrow. Most likely, if the market bounces tomorrow morning it will stall near the 214 level, which doesn’t give much room for upside. However, if lets say the MACD was positive and the candle was bullish, it would make me more likely to buy because momentum was in my favor and the market was less likely to stall.
SPY:
Slight negative bias. With today’s bounce at last months lows I think it could be forming a rectangular box patten. This means the spy will trade between 211-217. I would play this using either an iron condor or a butterfly. Given the broken wedge, there should have been a stronger reaction in the market if there was going to be a breakdown.
Today was a picture perfect double bottom at 211.24. I would use that as a pivot point, as a break of that should bring more downside.
AMZN
Wedge pattern
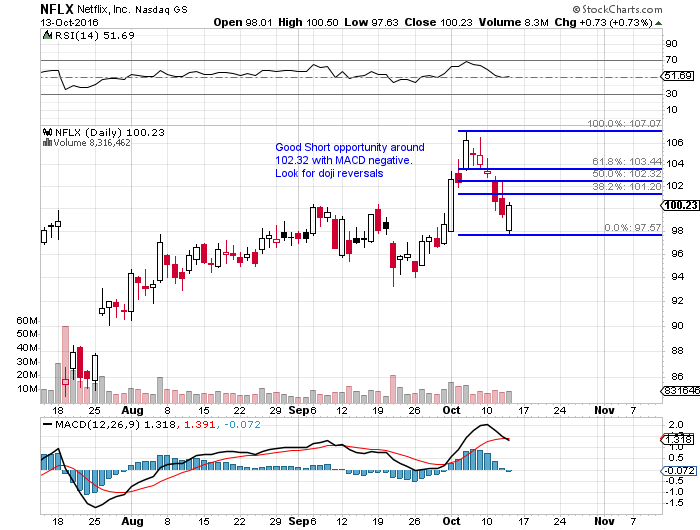
NFLX
Retracements to watch