Stocks hit new all-time highs yet again, but suffered a pullback into the close. Are stocks set for a big pullback as we approach the end of the year, or will today's dip be just another fabulous buying opportunity? One chart that will help show where the market is headed is posted below. When trying to look at where the market is headed, I think understanding where it's traded previously is important. Looking where stocks have traded at specific times in the past can lend a hand in determining where stocks are going in the future.
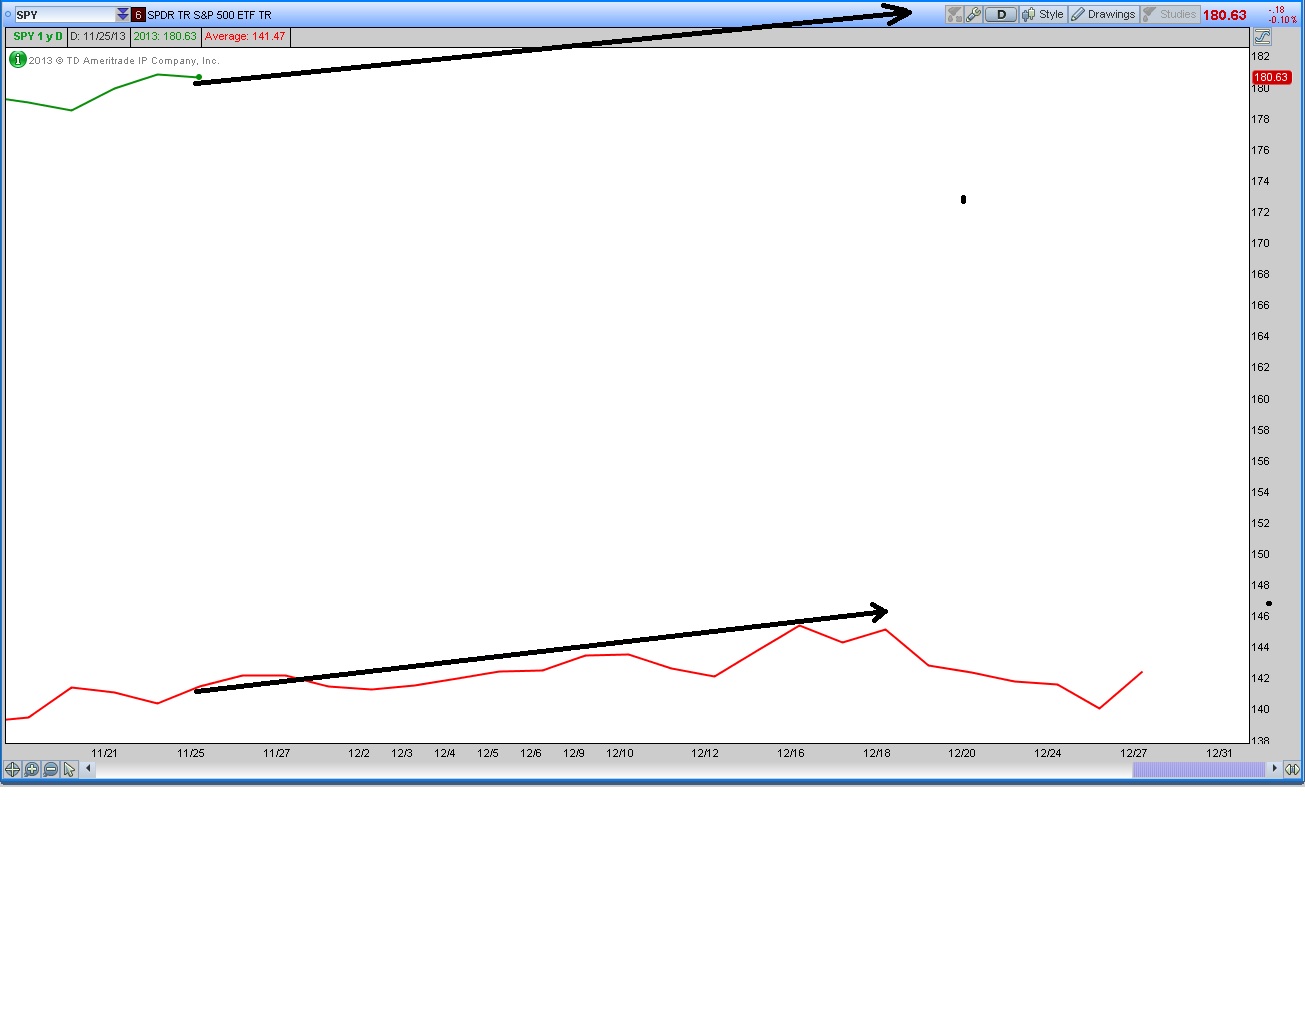
Below is a chart showing the current price of the $SPY (the green line) and the 5-year average of the $SPY (the red line).
Using price history as guide we should see a 3 percent rise from current levels heading into the Christmas holiday before a small sell-off as we get closer to the end of the year. A 3 percent rise would bring the S&P 500 to the 1,850 level and the DJIA to 16,500 before year's end.