
Stocks resumed their afternoon buying frenzy yesterday, shrugging off a nasty morning reversal lower to end the day over 1% higher.
$SPY was near that key psychological $200 level before price action turned south. After the bell $DB announced a near $7 billion loss, which was unexpected. Initially the stock fell after hours, but today the stock finds itself higher pre-market.
Jobless claims are lower this morning, but in order to claim unemployment you need to have a job. The last jobs report continues the trend of a labor force with a lack of participation. People don't have a job to get unemployed from.
The S&P500 continues to rally off last Monday's lows. Yesterday brought the market up to strong resistance:
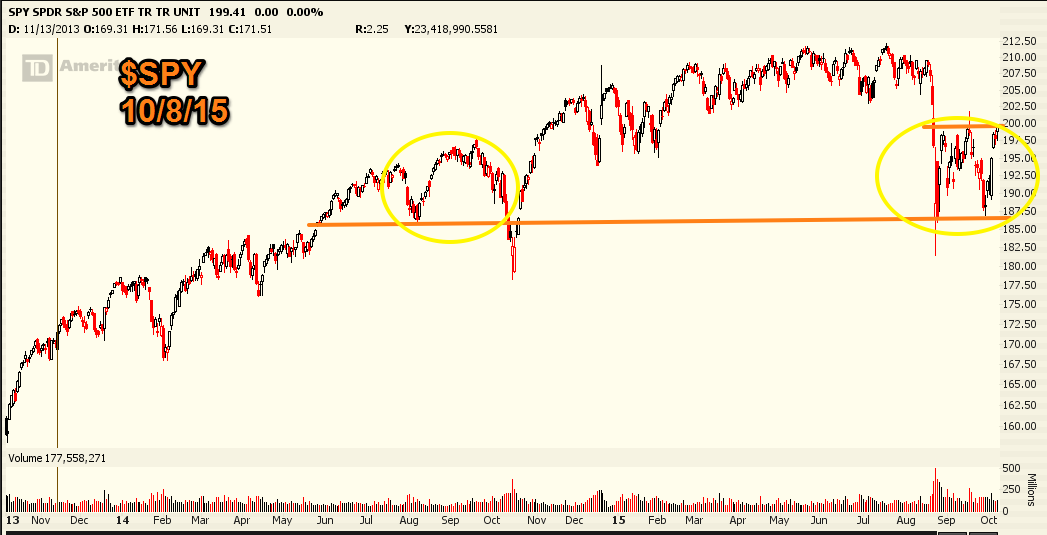
The August move lower and the recent bout of consolidation has formed a nice bear flag. I continue to say how well charts are working in 2015. Will this one work as well? We had $INTC move lower from a wonderful head and shoulders pattern. $HPQ break down on a nice topping pattern. $IBB broke down twice on two different bearish patterns that was shared here before the move. Will the S&P500 succumb to this pattern? Or are we looking at another failed bearish top, much like the ones we had in late 2009 and 2010?
If the market does break higher here, I think it's telling you massive QE is coming, the likes of which we haven't seen before. And this will launch stocks to heights we have yet to encounter.
As bearish as so many charts look, nothing stands in the way of free money. The recent action draws comparison to other QE rallies where trading for downside is akin to trying to drown a beach ball.
You ever try to drown a beach ball before?
One chart that aligns with my bearish perspective is $AAPL. In May of 2013 I was one of the few to see $AAPL soaring to new heights. Many laughed at me back then but now all those SELL ratings have turned to ever increasing price targeted buy ratings.
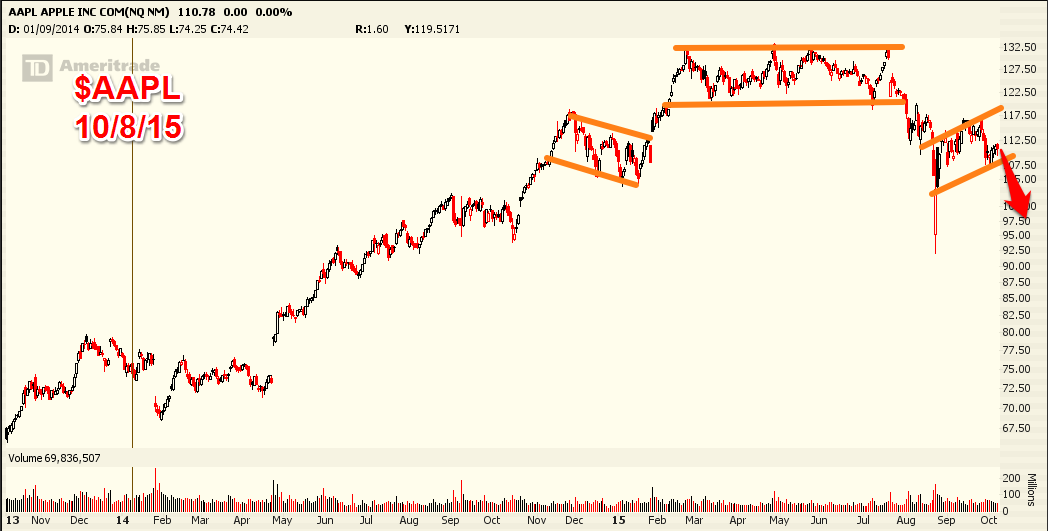
Maybe this chart won't work out. Perhaps it rallies back up to $117 first. But I like the risk reward for a move lower, and as such I am in some PUTs for the potential move lower.
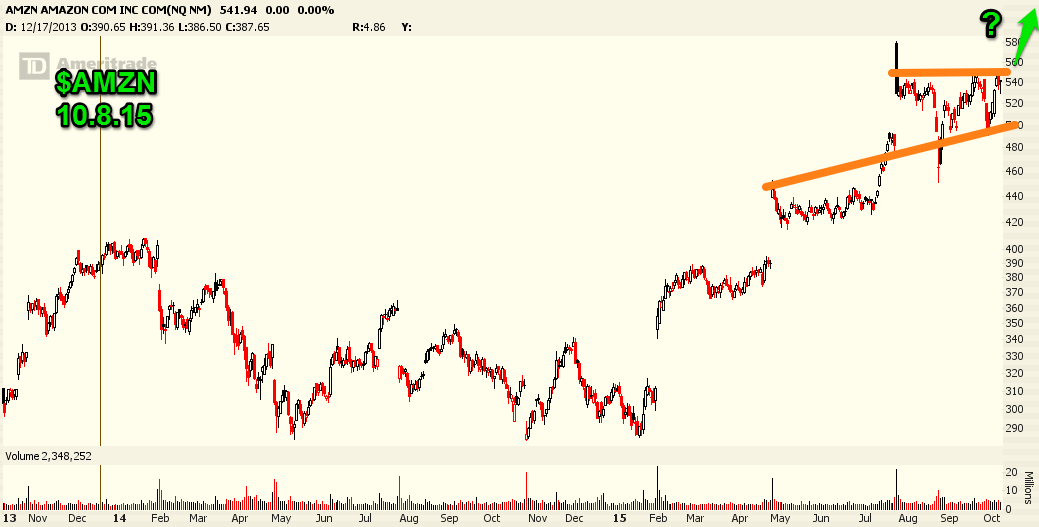
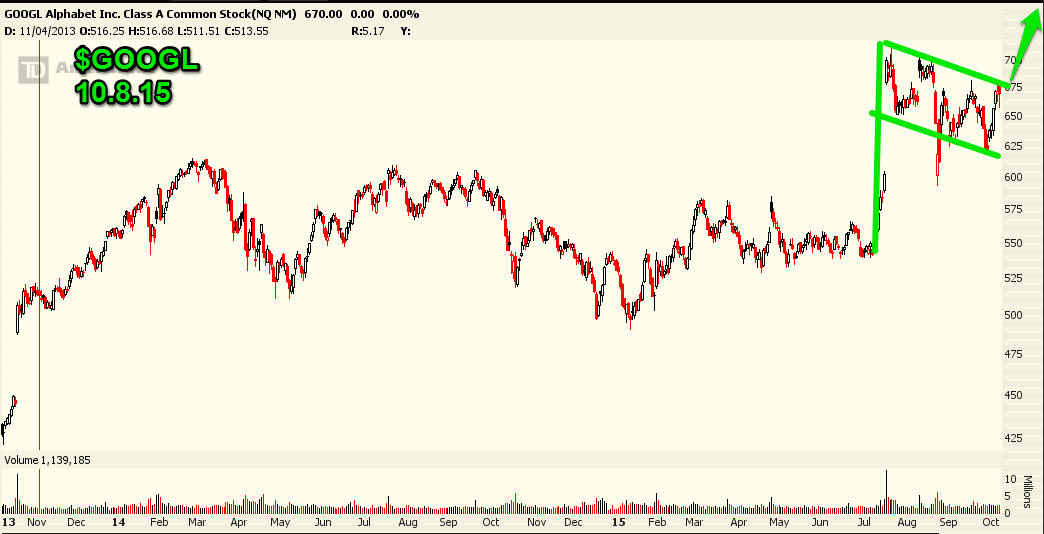
I am not bearish on everything. Look at $GOOGL and $AMZN. Both charts look stunning for moves higher. I thought $AMZN's chart looked good at $280. It looks even better now. $GOOGL lost that $550 peg, and is starting to trade like people want to own it. If $AAPL sells off look for the money to head into these names.
Finally the VIX continues to melt lower.
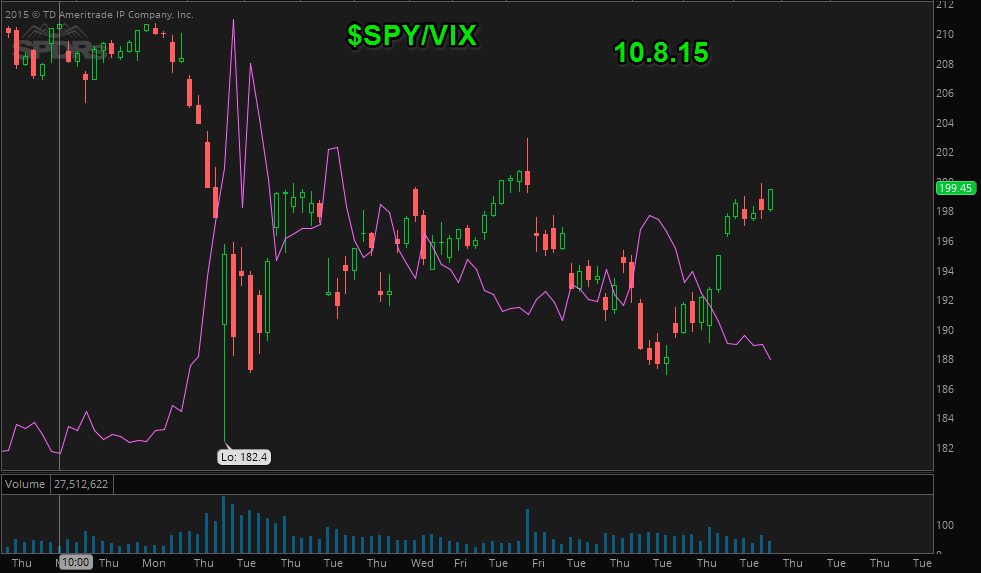
Continued VIX weakness will translate into more gains for the market. Write offs, bad economic data, layoffs... the market continues to shrug it all off.
Is there too much negativity in the market right now? I've seen a few notes saying to buy calls in heavily shorted names to ride the relief rally higher. I've seen investors talking about a move higher into years end on stock buy backs and short covering. No mention of positive economic data or job growth. Which makes me believe that this entire rally is being built on the backs of something that is not sustainable. Perhaps I'm wrong... but three weeks from now I think that won't be the case.
See you in the optionmillionaires.com chat room.